Hello there, readers! Going forward, this newsletter is going to be a weekly newsletter on Thursdays due to limited readership. If the situation changes, I’m happy to add another day to the schedule. If there are breaking developments in between newsletters impacting Kansas, you can follow me on social media via Facebook and Twitter where it’s easier for to get information out fast.
On my Georgia newsletter from yesterday, I discussed some of the safety data we have on the COVID-19 vaccine now that it is being used to immunize the public. There have been 29 individuals who had serious events, requiring an emergency room, out of the 4.8 million who have been vaccinated so far, or 0.000006% of vaccinated persons. To be clear, those events are pending investigations to determine whether they were truly due to the vaccine or unrelated causes. So that 0.000006% is a worst case scenario so far. The vaccine is proving very safe so far, in sharp contrast to the outcomes of getting infected with COVID-19. Earlier this week, Kansas was dead last in the nation for people starting the COVID-19 2-dose series per 100,000 residents. It has since improved, perhaps due to delayed reporting and the impact of back to back holidays. Hopefully Kansas continues to improve for this. A vaccine does no good in the freezer.
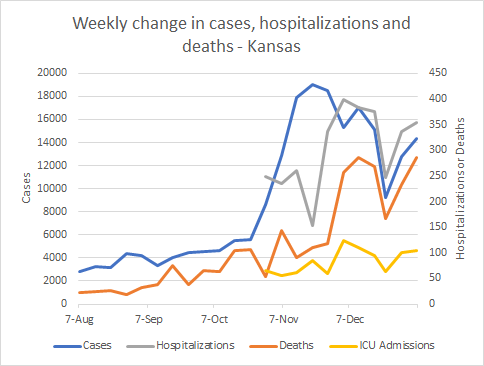
To start things off, data wise, here’s a look at how some of our big metrics are trending over time. We saw increases for cases, hospitalizations and deaths in the most recent two weeks and ICU admissions to a less dramatic extent. As much as everyone wants to be done with this pandemic, it is quite clear that Kansas is not out of the woods. In fact, the danger is growing once again.
Testing
Kansas is 34th in the nation for PCR tests performed per 100,000 residents last week, according to the HHS Community Profile Report from 05Jan2021. The state is ranked #16 in the nation for test positivity according to the same report. The graph below shows how the state’s positive rate compares to the national average over time.
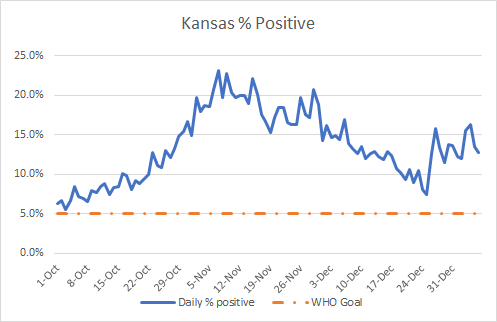
And if we look at day to day data (rather than weekly) from the Kansas Department of Health and Environment (KDHE), we can see that while the state has reduced its positive rate since early November, it is climbing again.
As a reminder, the positivity rate is important because it tells us whether we are testing widely enough to identify most cases. The higher the number is, the less likely that we are identifying most cases. Unidentified cases may not realize they’re infected and contribute to ongoing disease transmission. As the pandemic grows, testing should grow in kind.
Cases
Kansas is #12 in the nation for new cases per 100,000 residents over the past week. In the past week, we’ve seen case rate jump 84% and some of this may be due to holiday reporting delays that are catching up. We are back to being above the national average.
In the map below from the most recent White House Coronavirus Task Force report, you can see the counties where new case rate is most intense. Things have improved in western Kansas, but remain quite intense in the middle and eastern portions of the state.
Looking at more local data, we can see how the cases have been distributed across age groups for the past 8 weeks in the graph below. You’re looking at 8 week timelines side by side for each of those age groups.
You’ll notice that cases have climbed over the past two weeks for most age groups. We saw increases in every age group except those 85+. It’s noteworthy that these increases began the week of Christmas. Given the incubation period of the virus and delays in reporting, it is likely that transmission was growing, whether we realized it or not, leading into Christmas. That’s a bad sign for things to come, knowing that many Kansans ignored the public health recommendations to not gather with friends and families for the holidays.
Next, let’s look at how case rates are trending by county type in Kansas. You can check to see how your county is classified here.
Semi-Urban counties and Densely-Settled Rural counties have the highest case rates per 100,000. But things really are similarly intense regardless of county type.
Hospitalizations
Kansas is ranked #26 in the nation for new, confirmed COVID-19 hospital admissions per 100 beds in the past week. This is according to the HHS Community Profile Report from 05Jan2021.
The graph below shows the distribution of new COVID-19 admissions for the state across age groups. Again, you’re looking at 8 week timelines side by side.
We saw increases among those 0-9, 25-34, 45-64 and 75+.
The graphs below show how COVID-19 is impacting hospital capacity. The graph on the left shows ICUs and ventilators in use for COVID-19. We’ve seen that ICU usage has been largely flat for the past month or so. But ventilators in use for COVID-19 has been trending down, a very good thing, since these are the most severe cases of COVID-19. Turning to the graph on the right, this shows the number of COVID-19 patients admitted and the swings in the data are due to weekend effect and the Kansas decision to only report data three days per week. You can see through the noise that there has been a downward trend since the beginning of December, but we’ve seen some increase in the past week or so. We’ll have to wait and see if that materializes into a sustained increase.
Kansas is ranked #20 when it comes to COVID-19 patient demand for ICU beds. According to the most recent WHCTF report, 23% percent of Kansas hospitals report a shortage of supplies (including PPE), just above the national average of 21%. Nine percent of Kansas hospitals report staff shortages, well below the national average of 22%. So while the demand is high for hospitals right now, Kansas is doing better than many parts of the country when it comes to staff and supplies. That doesn’t give anyone license to stop being vigilant about virus transmission. With the resurgence in cases, we should anticipate that hospital demand will pick up as well.
Deaths
Perhaps the most dramatic shifts in data are observed for deaths. Kansas has the highest new death rate in the country and it is the highest the state has seen week to week. The Kansas death rate is 140% higher than the national death rate for COVID-19.
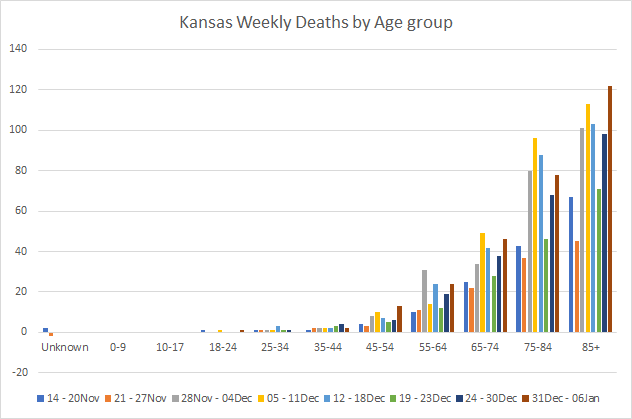
Let’s take a look at where these deaths are coming from, in terms of age, in the graph below. We’ve seen increases over the past two weeks for multiple age groups. In the most recent week, we see increases for those 18-24 and all age groups 45+. The increases are quite dramatic over the past two weeks for those 85+.
In terms of county type, the death rate is highest in rural counties, something observed for other states as well.
Thank you for reading! I’ll be back next week.
References
http://www.ipsr.ku.edu/ksdata/ksah/population/popden2.pdf
https://www.coronavirus.kdheks.gov/160/COVID-19-in-Kansas
https://covid.cdc.gov/covid-data-tracker/#vaccinations
https://beta.healthdata.gov/National/COVID-19-Community-Profile-Report/gqxm-d9w9
03Jan2021 WHCTF report for Kansas: https://drive.google.com/file/d/1Scuy_1rnVegkdOfMDrhWBqPFLSOLHVr7/view?usp=sharing
Kansas COVID-19 Updates is a free newsletter that depends on reader support. If you wish to subscribe please click the link below. There are free and paid options available.
My Ph.D. is in Medical Microbiology and Immunology. I've worked at places like Creighton University, the Centers for Disease Control & Prevention and Mercer University School of Medicine. All thoughts are my professional opinion and should not be considered medical advice.


