The Week in Context, 07Dec2020
Kansas COVID-19 Updates
As I mentioned in one of last week’s newsletters, we’re going to discuss some of the intricacies of the coronavirus vaccines over the next few weeks. The information can be overwhelming, so I want to lay things out in pieces. Last time, I talked about the Advisory Committee on Immunization Practices, a group of 15 voting members (one from CDC, the rest from academic institutions across America, including one consumer representative) who go over safety data and set the dosing schedules and vaccine policy for the United States. This committee sets the vaccine schedule for pediatrics as well as adult immunizations. Today we’re going to talk about how vaccines and other therapeutics are evaluated and how they progress through the FDA approval process. In other words, it’s the work that had to be done before applying for Emergency Use Authorization by the FDA and before ACIP sets the dosing schedule and policy. As a follow up, the New York Times published this possible timeline of when different populations might be eligible for vaccination over the next year. This second interactive tool from NYT estimates where you fall in the line of people waiting for a vaccine based on the county where you live, the type of job you have, your age and if you have any of the medical conditions that make one more vulnerable to severe cases of COVID-19.
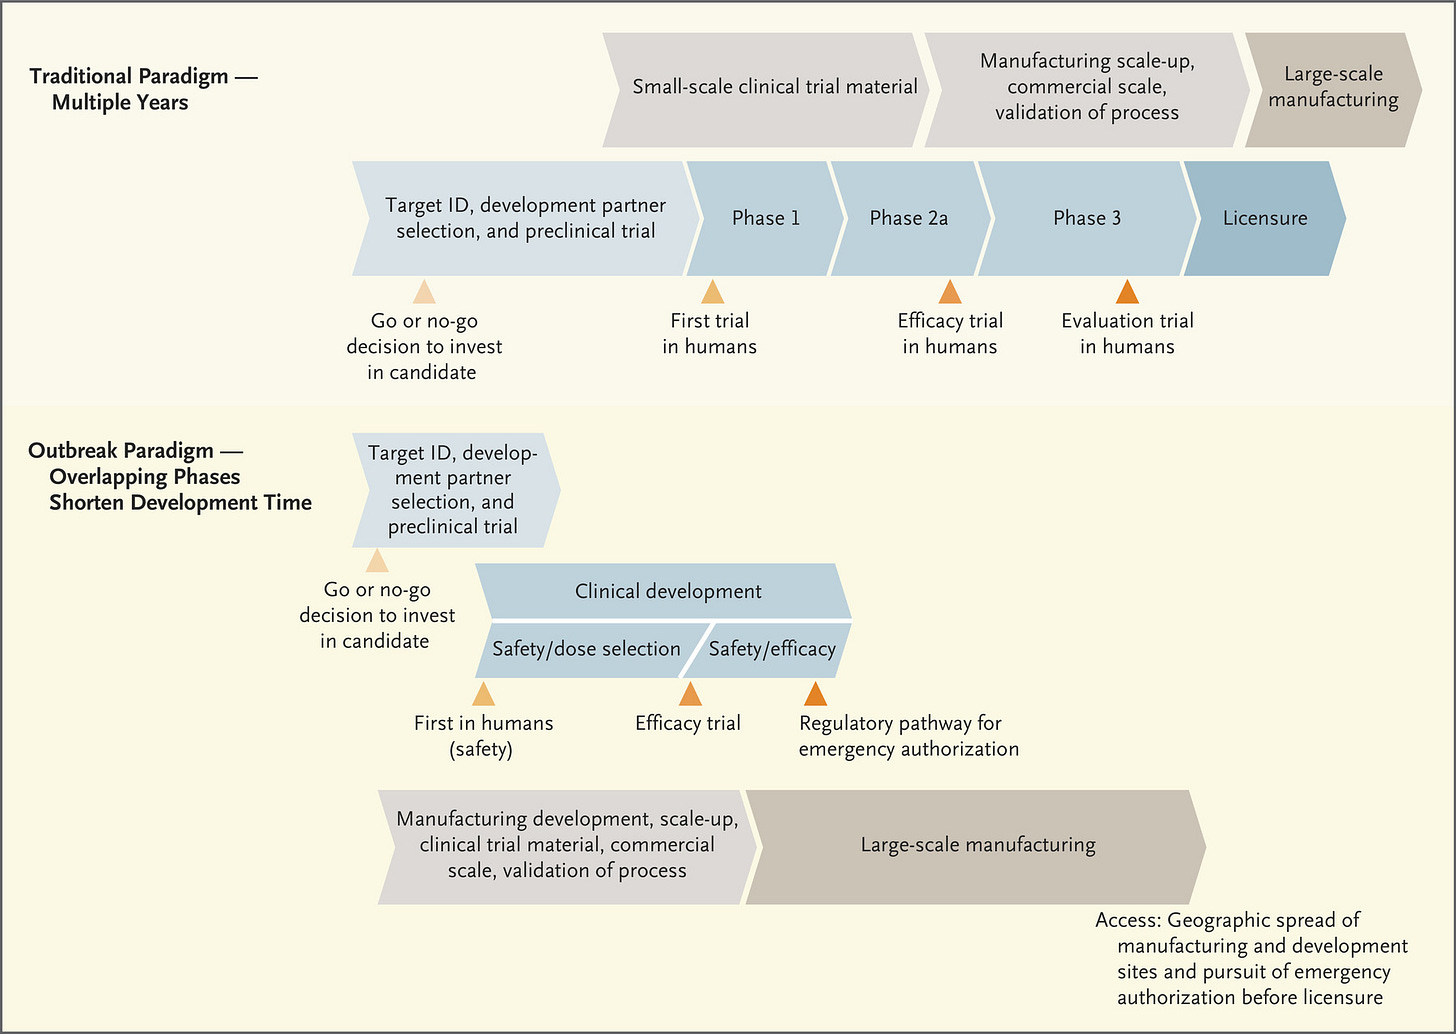
The figure below lays out how the FDA approval process typically works, when we’re not experiencing an emergency. A lot of it begins with basic science in research laboratories. “Basic” doesn’t mean simple or even cheap - it studies how living things work at their most fundamental levels - the interaction of cells, proteins, nucleic acids, and other biomolecules. The research they’re doing often doesn’t have an immediate clinical impact on human health. For example, I used to teach about researchers in Antarctica who were studying the composition of cell membranes (the cell borders) in fish that live in very cold temperatures. What does a cold water fish’s membrane composition have to do with human health? Well, it turns out that the way those cell membranes keep from freezing and locking into place (disrupting cross-membrane transport of nutrients, etc) is by inserting more cholesterol (and related molecules) into their membrane. To do this, they deliver cholesterol to the cells via the bloodstream. How do these fish maintain cardiovascular health when we know that high cholesterol in the bloodstream is detrimental to cardiovascular health in humans? What mitigation strategies do they use and can we use something similar in a therapeutic for humans? So, you see, the basic science is very specific. But it is also iterative and collaborative. As more information is learned about the intersection of molecular biology, chemistry and physiology in living things, the information builds on itself and we connect the dots and solve problems. But this process can take years, which is why it is so critically important to fund basic science investigations robustly and over the long term. All of this effort feeds into the early stages of the timeline shown below.
One big thing I want you to take away from the diagram above is the TIME that it takes to go through this process, and it assumes that everything goes well as the process goes on. The process slows or stops if problems arise. Also pay attention to the fact that safety is a feature of all three phases of the clinical trials, gradually increasing the population size of people or animals in the studies to verify safety. Phase I focuses exclusively on safety - can we administer the vaccine/therapeutic and see minimal (if any) side effects? Phase II continues to look at safety, with a larger population, and now checks for immunogenicity or the ability to generate an immune response. Do the trial participants make antibodies in response to the vaccine? If they see that it does, in fact, result in antibody production and is still safe, then they progress to Phase III. In Phase III, the population size increases further. But now that we know that people who receive the vaccine produce antibodies, it’s time to test efficacy - does the vaccine, and the antibodies test subjects are producing, actually protect people from being infected with COVID-19? Along the way, data are being submitted to the FDA as each phase is being conducted. In the next diagram, the traditional paradigm section is more or less the same as what you see in the figure above, but it adds the manufacturing process in gray/tan. You’ll notice that large scale manufacturing begins only after the FDA licenses the vaccine or therapeutic.
But these aren’t ordinary times. We can’t remain in this societal state of suspended animation for 10+ years waiting for the COVID-19 vaccine. So the process is streamlined during public health emergencies. It’s important to note that corners are not being cut by expediting this process - the safety and efficacy checks are still happening and still with large population samples. But it’s less iterative - you can move to the clinical development in humans, for example, as you’re continuing to gather data during pre-clinical trials (i.e. in laboratory animals). The other thing that really distinguishes this timeline from the traditional timeline is that the manufacturing process begins right away, this is “Operation Warp Speed” as the US government has named it. This means pretty big investment in a number of vaccines as they’re being developed, even knowing that some of them won’t ultimately work or meet FDA approval. But the idea is that the investment is worth it to get working/approved vaccines mass produced for the public so they can be administered as soon as we have approval.
Another arm of “Operation Warp Speed” is not just the manufacturing but the distribution of those vaccines as they come off the line. But the third thing we need is to educate the public and get public buy-in to taking the vaccine, to the tune of >70% of the population in order to achieve herd immunity. That requires building public trust in the process of vaccine development, and that is what I’m trying to accomplish by teaching you how vaccines work and how they’re tested. People fear what they don’t understand. If we can understand better, then the anxiety might diminish, replaced instead with confidence.
That’s it for today on vaccines. Next time, we’ll dig a little deeper into what antibodies are and how our immune systems respond to vaccines, including why all three of the COVID-19 vaccines applying for EUA from the FDA require two doses.
The World
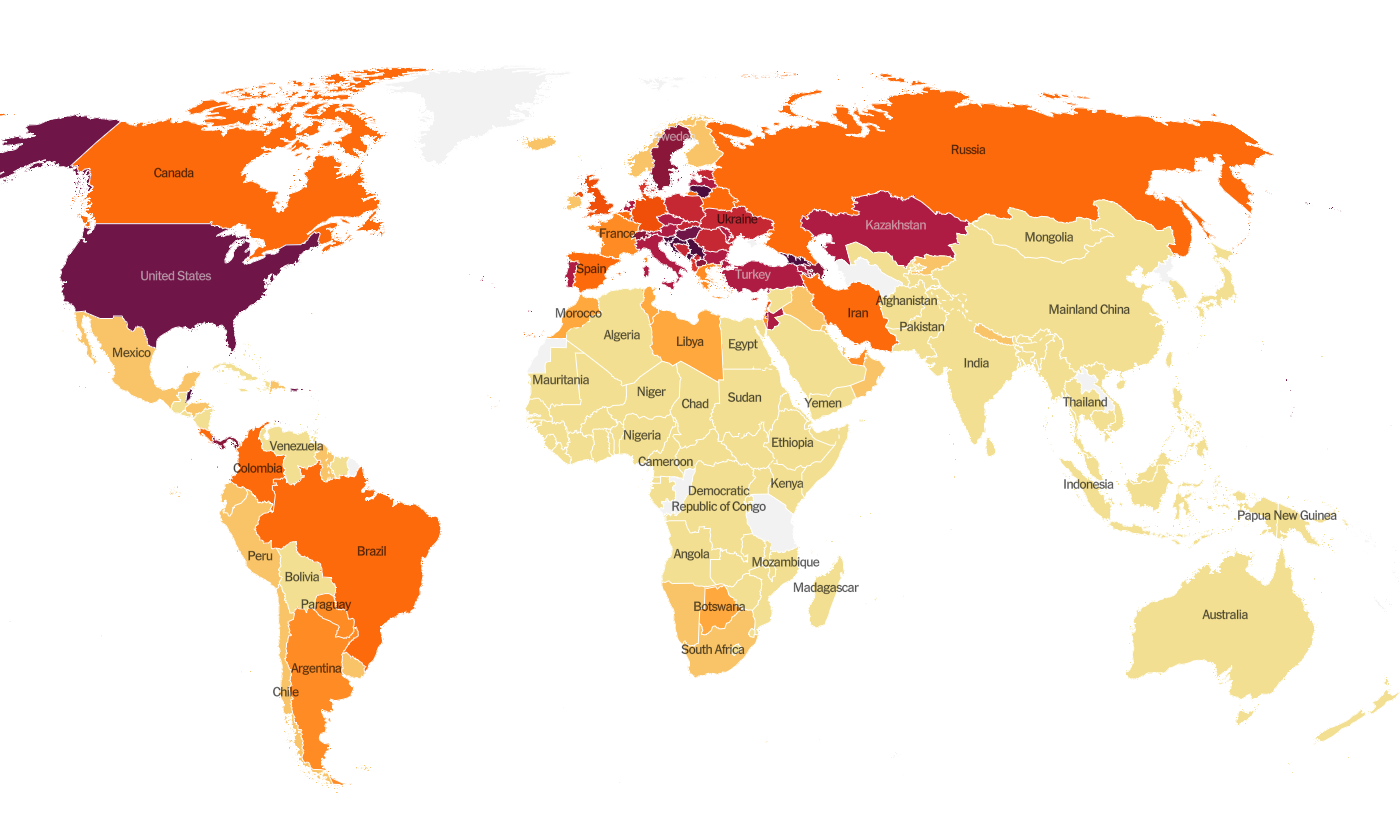
Globally, the SARS-CoV-2 virus that causes COVID-19 disease has sickened > 67.1 million people (+4.3 million since last week) and killed at least 1,537,400 (+76,800 in the past week) as of this morning.
The US is ranked among the top color categories for hot spots. We are ranked #12 in the world for average daily case rate per 100,000 people over the past 7 days (last week, 15th) with a rate of 59.3 compared to 48.8 last week. The top five countries for average daily case rate per 100,000 in the past week are Georgia, Serbia, San Marino, Luxembourg, and Croatia. It seems that most of Europe has beaten back their fall/winter surge.
For deaths, our average daily death rate per 100,000 over the past week is 0.7, and we are ranked #26 in the world for this (last week we were ranked #37). The top five countries for average daily death rate per 100,000 in the most recent week are Slovenia, Bulgaria, Hungary, Croatia, and Bosnia and Herzegovina.
The United States
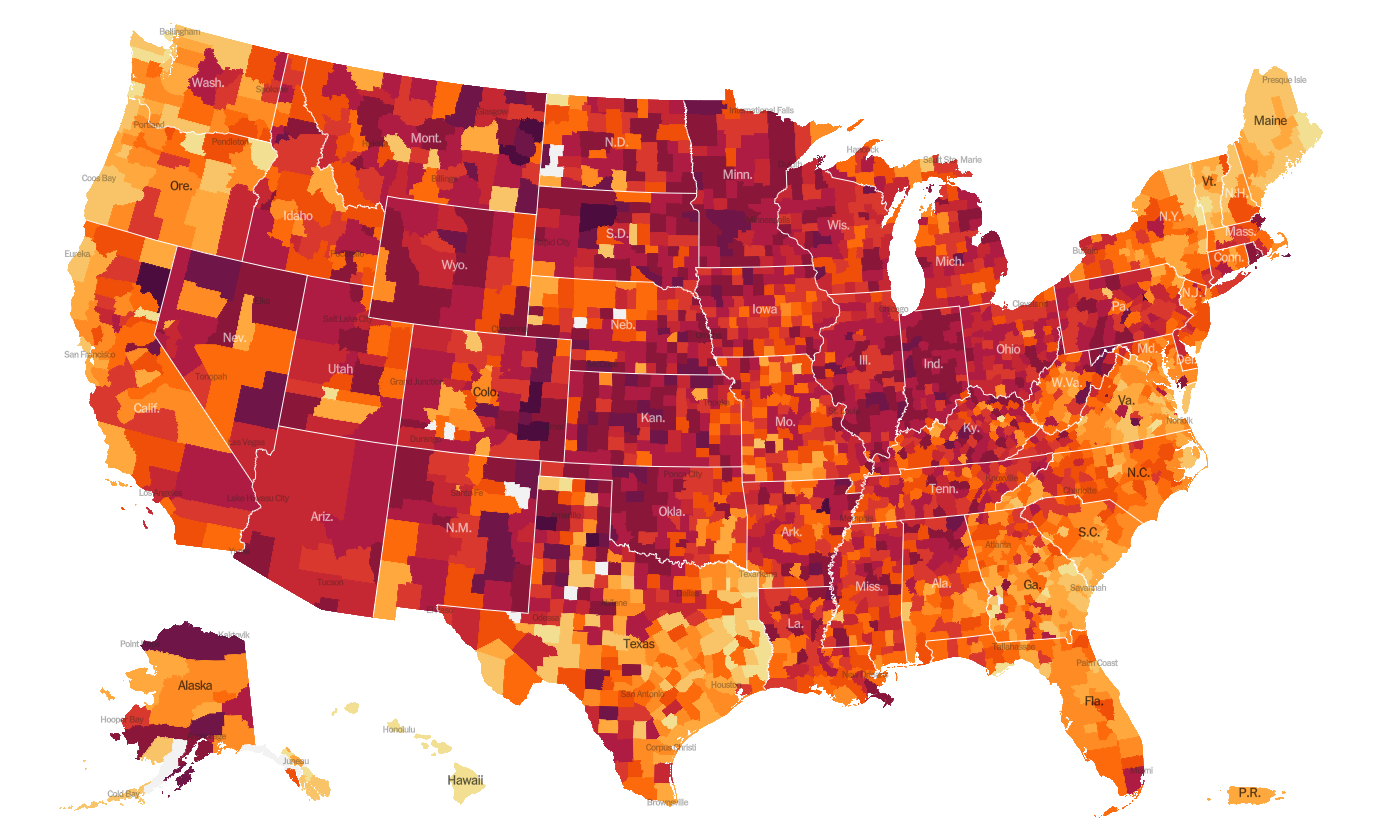
As of this morning, there have been over 14.8 million cases (+1.4 million in the past week) and 282,313 deaths in the US (+15,555 in past week). Keep in mind that both of these numbers are probably an under-count of the situation in our country and the effect may be even worse this week due to Thanksgiving.
This week we see things intensifying for the South and things have gotten slightly better for the Southwest, especially the west panhandle of Texas. The top five states in the nation for average daily case rate in the past 7 days are Rhode Island, Indiana, Nebraska, South Dakota, and Alaska. The top five states in the nation for average daily death rate in the past 7 days are South Dakota, North Dakota, Iowa, New Mexico, and Nebraska.
The table below tells you where we are this week and how that compares to the previous week (in parentheses). The data for everything but the percent of inpatients with COVID-19 comes from the New York Times coronavirus tracker and is current as of this morning. The hospital data comes from the HHS Protect Public Data Hub that was last updated on 04Dec2020.
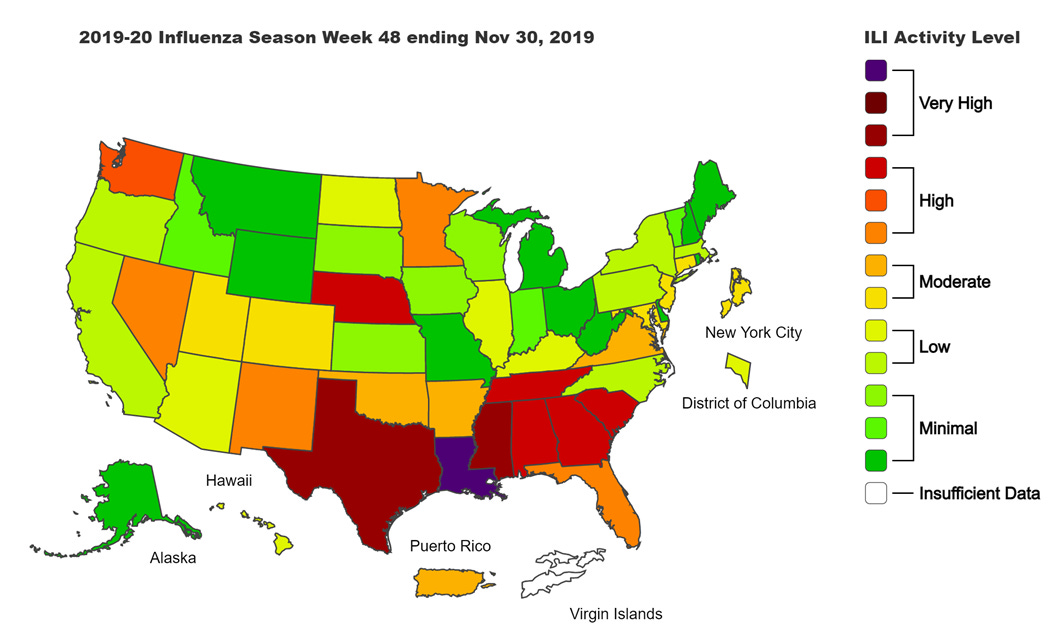
Next, let’s look at how seasonal influenza is impacting different states across the US. You can consult FluView any time you’d like to see this map and other data visualizations. You can read the weekly report from Kansas Department of Health and Environment here.
This week we see an increase in the number of states in the upper tier of the “low” category. But overall, influenza activity is low in the US right now. Compare that to where we were a year ago for week 48 in the map below.
So clearly this year is different. The things we’re doing to limit the transmission of COVID-19 are also interrupting the transmission of influenza. Good job! Remember, it’s not too late to get your flu shot. Please do so, if you haven’t already.
Kansas
The map from the Harvard Global Health Institute is pretty boring for Kansas - though alarming. The entire state is red save for one county (Morton) in the southwestern corner.
Given the length of the text at the beginning of this update regarding the vaccines in development, I think I will cut it short here and be back later this week with Kansas data and the latest White House Coronavirus Task Force report. In the meantime, make good decisions. Be safe and be well!
References
https://www.nytimes.com/interactive/2020/world/coronavirus-maps.html
https://www.nytimes.com/interactive/2020/us/coronavirus-us-cases.html?name=styln-coronavirus®ion=TOP_BANNER&block=storyline_menu_recirc&action=click&pgtype=Interactive&impression_id=97ba8610-2dbb-11eb-a0bf-4f82d045d121&variant=1_Show
https://www.coronavirus.kdheks.gov/160/COVID-19-in-Kansas
https://www.cdc.gov/flu/weekly/fluviewinteractive.htm
https://protect-public.hhs.gov/pages/hospital-capacity
Traditional vaccine development timeline: https://www.nejm.org/doi/full/10.1056/NEJMe2025111
Developing vaccines at pandemic speed: https://www.nejm.org/doi/full/10.1056/NEJMp2005630
Who and what is the Advisory Committee on Immunization Practices: https://www.cdc.gov/vaccines/acip/members/index.html
NYT estimate timeline of vaccine eligibility: https://www.nytimes.com/2020/12/02/briefing/pfizer-vaccine-elliot-page-trump-children.html
NYT interactive tool to find your place in line for a vaccine: https://www.nytimes.com/interactive/2020/12/03/opinion/covid-19-vaccine-timeline.html
Kansas COVID-19 Updates is a free newsletter that depends on reader support. If you wish to subscribe please click the link below. There are free and paid options available.
My Ph.D. is in Medical Microbiology and Immunology. I've worked at places like Creighton University, the Centers for Disease Control & Prevention and Mercer University School of Medicine. All thoughts are my professional opinion and should not be considered medical advice.


