


Kansas COVID Weekly, 14Jan2021
Kansas COVID-19 Updates

Vaccine Update
Kansas is ranked #33 in terms of vaccine doses distributed to the state, and #31 in terms of doses administered per 100,000 residents. According to the most recent White House Coronavirus Task Force report for the state of Kansas, 2.7% of the adult population has received their first dose of the COVID-19 vaccine. That’s better than the national average (2.5%). But we still have a long way to go to achieve herd immunity.
You can see the Kansas vaccine information page here. The Centers for Disease Control and Prevention COVID-19 Vaccine Data Tracker is also a useful too, but be advised that the Kansas numbers are only updated with them on Monday, Wednesday and Friday.
So far, the vaccine is proving to be very safe so far, confirming the findings of the clinical trial data for both the Pfizer and Moderna vaccines. According to the Vaccine Adverse Event Reporting System there have been just 64 people who had an emergency room visit associated with the COVID-19 vaccine. It should be noted that these are just associations and are pending investigation to determine whether the vaccine was the cause of the person’s emergency or if it was due to other factors (i.e. car accident, etc). Still, 64 people (worst case scenario) with an ER visit of 10,278,462 doses administered so far is only 0.000006%. Only 6 of those 64 patients were there for an anaphylactic (severe allergic) reaction. I will be getting my vaccine as soon as it is made available to me. I would encourage you to do so also.
Combined Data
The graph below shows us how some of our most important data points are moving over time. Cases are represented by the blue line and correspond with the left y-axis. All other metrics (hospitalizations, ICU admissions, deaths) correspond with the right y-axis.
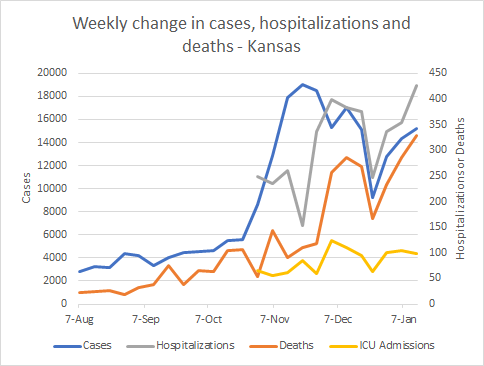
We can see that there was a big dip the week that closed on 23Dec but the numbers have increased for cases, hospital admissions and deaths ever since then. That’s most likely due to the fact that I’ve shifted my weekly analysis to look at Wednesday - Wednesday since it seems like there are a lot more holidays on Mondays and Fridays this year and we were seeing big interruptions in the data. So the week closing on 23Dec was a short “week.” But it is also possible that things were truly getting better leading into Christmas and now we are seeing the effects of holiday gatherings on most of our metrics here (ICU admissions being the exception). The evidence that makes me think this way is the fact that the week after the 23rd was still lower than the week prior to the 23rd, for most metrics other than ICU admissions.
The most recent White House Coronavirus Task Force report shows that Kansas is ranked #24 for new case rate per 100,000 (red zone), #18 for test positivity (red zone), #30 for new COVID-19 hospital admissions per 100 beds, and #8 for new deaths per 100,000. The dates of data collection for this week’s report were 02 - 08Jan2021. You can read the report in full here.
Testing
The graph below shows us how Kansas is doing for tests performed (blue line, left y-axis) and the percent of those tests that are positive (red line, right y-axis) on a weekly basis. The goal line for test positivity (5%) is indicated by the gray, dashed line.
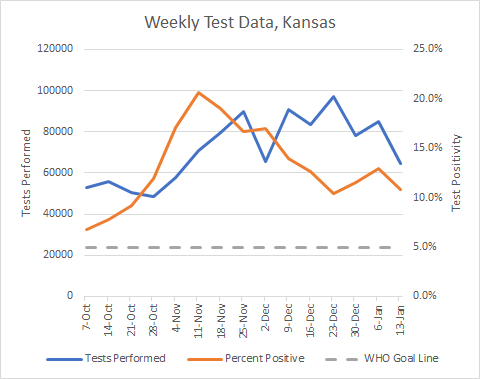
Test output has increased significantly since late October but has declined in the past three weeks. The percent of tests that are positive has also been declining and that’s a good thing. But the decrease in positivity has stalled since 23Dec and remains above 10%. Test positivity is helpful for telling us if we are doing enough testing. The idea is that we want 95% of the tests we perform to be negative - it’s an indication that we are testing widely enough to not miss many cases. The higher the positivity rate, the more cases we are likely missing and those missed cases contribute to ongoing disease transmission in the community. The higher the positivity rate, the more likely our current case count is an underrepresentation of the disease burden.
Cases
In the past week there have been 15,233 cases newly reported by the Kansas Department of Health and Environment. The graph below shows us where those cases are coming from in terms of county type. You can check your county’s classification here.

The state average is shown with the black line. It has decreased from the peak experienced in mid-November, but really has been stable for the past month or so. That means there is still a LOT of disease in the community and we likely aren’t doing enough to bring transmission down. That’s a vulnerable place to be, because that means there’s a lot of disease that could drive further increases given the right conditions. Case rate is worst in semi-urban counties and best in frontier counties (the most sparsely populated counties). The top five counties for 14-day case rate per 100,000 are Rooks, Osborne, Kiowa, Mitchell and Geary.
Next, let’s look at where the most recent week’s cases are coming from in terms of age groups. The graph below shows 8 week timelines for each age group with the most recent week shown in maroon. Again, remember that the “week” of 19-23Dec was a shorter week than usual so that week’s data are an anomaly.

So ignoring the week of 19-23Dec, we really haven’t seen decreases in the weekly cases for any age group. However, we are seeing sizeable increases in the most recent week for children and young adults, ages 0-24. That is, of course, concerning as K-12 and colleges and universities resume face to face instruction for the spring semester. So far, we aren’t seeing a lot of increase in the “unknown” category. That’s a good thing, because that’s a holding area for cases that are pending investigation and follow up. So seeing that category stay at zero or very small means that contact tracers in Kansas are not being overwhelmed by the current case load.
But there was something weird that happened this week with cases by race. On Monday, the KDHE reassigned 4538 cases from the “other” race category to “not reported/missing.” The “other” category includes the majority of people who identify as Hispanic or Latinx. Data corrections happen from time to time, but this seems more than clerical error. I’ve asked KDHE for clarification and they related to me that there was a laboratory who misunderstood the distinction between “other” and “unknown” when it comes to race as they were submitting data to the state. The erroneous reporting was happening for weeks - months. So it’s possible that this big influx in the “unknown” category will be sorted out into the correct race as they investigate and follow up with those 4538 cases.

Hospitalizations
The graph below shows how many hospital admissions and ICU admissions for COVID-19 have been reported each Monday, Wednesday and Friday by the KDHE. I don’t have a trendline here, but you can see that the trend for hospital admissions has been upward for the past several months. So we aren’t really seeing things move down the way that we would like to see.

This week there were 427 newly reported hospital admissions compared to the week prior, an increase of 21%. The graph below shows us where those hospital admissions are coming from in terms of age group, over the past 8 weeks. I want to again remind you to not worry too much about the week of 19-23Dec because it was a short week.

What we see from the graph above is that hospital admissions are climbing for everyone except those 0-9 and 45-54. Hospital admissions rose most dramatically among those 65+, who are among our most vulnerable to severe disease.
An important question is how hospitals are coping with the burden of COVID-19 and one way to measure that is how COVID-19 patients compare to their overall patient load (sometimes referred to as the patient census). Among the most critical resources for severe cases of COVID-19 are ICU beds and ventilators and the staff that support those resources. The COVID-19 burden for both of these resources has been elevated but stable for the period between 15Nov and the start of the new year. The COVID-19 patient census for both ICU beds and ventilators has decreased since the start of the new year and hopefully that trend continues.

Deaths
Using the HHS Community Profile Report (date 12Jan2021), Kansas has the second highest newly reported death rate per 100,000 residents in the country, just behind Arizona. You’ll note this ranking differs from the White House Coronavirus Task Force Report. The HHS Community Profile Reports are the source material for the White House reports, but the dates are different here with the HHS report being more current.
In the most recent week, Kansas has reported a net increase of 328 deaths, an increase of 14.7% compared to the previous week. The graph below shows us how deaths have trended over time, adjusted for each county type’s population size. The statewide average is shown in the black line.

The death rate for Kansas remains very high, but lower than the record set around 01Jan2021. Death rate is worst in densely-settled rural counties and best in frontier counties as of this week. The counties with the highest 14 day death rate are Kiowa, Brown and Pawnee.
We can also see where deaths are coming from in terms of age group in the graph below. Like the other demographic graphs, this shows 8-week timelines for each age group. This week we saw increases in deaths among those 45 - 84.

In closing, we aren’t really done with this surge that began in November, even as news focus has shifted elsewhere in the country. There are signs that things are growing more intense for cases, hospitalizations and deaths. I know we are all tired of wearing masks and social distancing. But the reality is that until we achieve herd immunity (estimated to be 70-90% of the population) with the vaccine, those masks and social distancing remain our best defense against the virus. Please continue to do what you can to limit disease transmission.
References
https://covid.cdc.gov/covid-data-tracker/#vaccinations
https://www.kansasvaccine.gov/
http://www.ipsr.ku.edu/ksdata/ksah/population/popden2.pdf
https://beta.healthdata.gov/National/COVID-19-Community-Profile-Report/gqxm-d9w9
10Jan2021 White House Coronavirus Task Force Report, Kansas: https://drive.google.com/file/d/1OuU7bcwUlrrlR0Hb-_naZCNLTmt0fjvv/view?usp=sharing
https://www.coronavirus.kdheks.gov/160/COVID-19-in-Kansas
Kansas COVID-19 Updates is a free newsletter that depends on reader support. If you wish to subscribe please click the link below. There are free and paid options available.
My Ph.D. is in Medical Microbiology and Immunology. I've worked at places like Creighton University, the Centers for Disease Control & Prevention and Mercer University School of Medicine. All thoughts are my professional opinion and should not be considered medical advice.