Good afternoon! There have been some positive developments this week with the coronavirus vaccine. I really liked the say Dr. Anthony Fauci described the situation at a press conference yesterday. He likened the coming vaccine as the “cavalry is coming.” But “if you’re fighting a battle and the cavalry is on the way, you don’t stop shooting.” We still have to do our parts to limit transmission, especially with things escalating as they are.
That being said, things continue to get worse and worse at a national level. In my area, the stores are running out of things that aren’t necessarily part of the typical pre-Thanksgiving rush. The percent positive rate is sky high. Many of my neighbors are preparing for another shelter in place order. I have found that my anxiety about all of this is escalating too. Having lived in the COVID-19 data since mid-March, I know what is coming. If we knew that a catastrophic hurricane was bearing down on our area, we wouldn’t carry on with life as usual. Everyday people would be making preparations. And yet, that is not the culture we live in. I had a hard time naming what was driving my inability to concentrate, etc, until I saw this tweet. I mention this today to offer my solidarity if you are feeling the same way. You are not alone.
The CDC had its first press conference in months yesterday, to offer an update on the coronavirus. They unveiled new guidance on Thanksgiving travel and celebrations. They are cautioning against gathering with anyone from outside your household, among other guidance.
Again, we aren’t in a great spot right now nationally. In fact, the New York Times coronavirus tracker had to add a new color to their map to show intensity beyond red.
Testing
The state of Kansas updates their testing data retroactively. So when tests are reported to the state, it appears they are backdated to the date on which the test was completed, not necessarily the date they were reported to Kansas Department of Health and Environment. So there is often a lot of data correction as time goes on and testing is where I see that most. All the same, there may be some good news in the testing data. While the number of tests performed is certainly higher than it was in October and so are the positives, the positives this week seem to be less than the weeks before. We’ll need to hope and see whether this trend holds.
In total, there were 15,632 new test results reported since the Wednesday update and 38% of them were positive. Remember, the goal is to be at or below 5% for a sustained period of time. So our rate is 6.6 times higher than the goal. It’s not a good spot to be in. When the percent positive rate is high like this, it means that we aren’t testing widely enough to identify all the cases, and especially those who might be asymptomatic and contributing to ongoing disease spread.
Cases
There were 5939 new COVID-19 cases reported with today’s noon update. That brings the statewide total to 134,533. Cases have increased by 40% in the past two weeks and the statewide 7 day case rate per 100,000 is 689. Below you can see how things have trended for different county types across Kansas. You can check your county’s classification here.
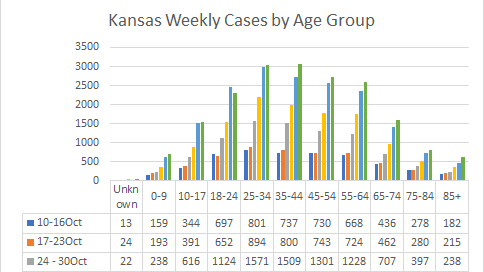
You’ll see that case rate has risen dramatically. In fact, this is considered exponential growth which will mean that cases grow very high, very fast. The case rate is increasing for all county types. It does not matter whether you’re in an urban or rural setting. Next, let’s look at how cases have trended over the past six weeks for different age groups. In the graph below, you’re looking at timelines for each age group side by side. The green bar is the most recent week.
You’ll see that the exponential growth we’re seeing on a statewide level is happening for those aged 18 - 64, and cases are rising at a slower rate for other age groups. The next graph shows data from the weekly cluster update that KDHE provides on Wednesdays. It shows the settings in which clusters of disease were found in the past three weeks. The top three outbreak settings in the past week were long term care facilities, schools and private events. We see that the outbreaks are increasing, week-to-week, for healthcare, private events, and schools.
Of course, an outbreak or cluster can be big or small. The graph below shows how many cases were associated with each cluster setting over the past three weeks. This week, the most common outbreak settings for cases were long term care facilities, corrections, and schools. Two of these are congregate settings, and the third (schools) is an environment where people spend several hours together. Similar to the graph above, week-to-week increases are noted for group living, healthcare, meat packing, and the greatest week-to-week increases are found in schools.
It should be noted that only 16% of the cases identified to date have been linked to an outbreak cluster. The remaining cases are the result of widespread community transmission. As contact tracers get more overwhelmed, it can be harder to perform the investigations that link these infections together.
Hospitalizations
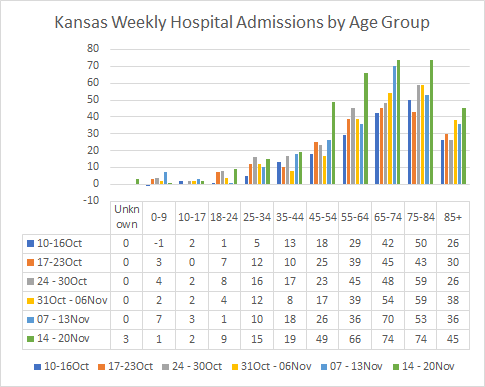
There were 121 newly admitted COVID-19 patients since Wednesday’s update. In total, 4682 patients have been hospitalized to date, for a hospitalization rate of 3.6%. Since Wednesday, 85 patients were admitted to the ICU and 23 patients were placed on a mechanical ventilator. The graph below shows how hospitalizations have been distributed by age group for the past six weeks. The green bar is the most recent week. Hospital admissions are trending up for several age groups but the increases are largest for those 45-64 and 75-84 in the past week.
On a cumulative basis, the hospitalization rate increases with age, but it doubles between the age groups of 55-64 and 65-74, going from 5.1% to 10.2%. In fact, for those aged 65+, the hospitalization rate is 12.8%, about four times higher than the statewide average. Next, let’s consider how COVID-19 is impacting some of our most critical and limited resources in the hospital setting, ICU beds and ventilators. The graph below shows the proportion of ICU beds or ventilators that are in use for the treatment of COVID-19 compared to all occupied ICU beds or ventilators.
The percentage is growing for both resources. Compared to 18Oct, the percentage of ICU beds in use for COVID-19 has more than doubled, 116% higher. For ventilators in use for COVID-19, the percentage has increased 65%. These are not sustainable increases. If our case rate continues to climb, we will overwhelm our hospital capacity to care for the most seriously ill.
Next, let’s look at how clusters of illness are contributing to hospital admissions over the past three weeks. The top sources of cluster-associated hospitalizations were long term care facilities, group living, and then a tie between healthcare and religious gatherings. We see an alarming week-by-week increase for long term care facilities and healthcare settings, to a lesser extent. Forty three of the week’s 130 hospitalizations (as of Wednesday) were associated with a cluster setting. The remainder are the result of widespread, uncontrolled community transmission.
Deaths
There were 84 newly reported deaths today compared to the Wednesday update. That brings the statewide total to 1410, for a case fatality rate of 1.1% for Kansas since the start of the pandemic. Of course, that fatality rate increases with age. In fact, the graph below shows how fatalities have been distributed across age groups for the past six weeks. Deaths are trending up most dramatically for those 85+. The age group of 65+ makes up just 13.7% of the state’s cases to date. However, they comprise 84.2% of the deaths so far. It’s also important to remember that survival and death are not the only outcomes for COVID-19 illness. There are many people who have long term health complications following their disease.
As I did for cases and hospitalizations, here’s how deaths have been associated with different outbreak settings in the past 3 weeks. The top three settings are long term care facilities, followed by meat packing plants and religious gatherings.
That’s it for today. Make good choices regarding your exposure risks. Stopping this exponential growth requires us to put our community’s needs ahead of our own. Anything you can do toward that goal will save lives.
References
https://www.nytimes.com/interactive/2020/us/coronavirus-us-cases.html?name=styln-coronavirus®ion=TOP_BANNER&block=storyline_menu_recirc&action=click&pgtype=LegacyCollection&impression_id=4c28e731-2b4c-11eb-a87a-7d7768bcf50a&variant=1_Show
http://www.ipsr.ku.edu/ksdata/ksah/population/popden2.pdf
https://www.coronavirus.kdheks.gov/160/COVID-19-in-Kansas
Kansas COVID-19 Updates is a free newsletter that depends on reader support. If you wish to subscribe please click the link below. There are free and paid options available.
My Ph.D. is in Medical Microbiology and Immunology. I've worked at places like Creighton University, the Centers for Disease Control & Prevention and Mercer University School of Medicine. All thoughts are my professional opinion and should not be considered medical advice.


