COVID-19 in Kansas, 12Nov2020
Kansas COVID-19 Updates
Hey there readers! First of all, I’m sorry for the gap between my previous post and this one. I’m going to try to prioritize some big issues today and will get back into a regular rhythm with the updates.
I’m sure you’ve probably seen the news, but we are not in a good spot right now for the pandemic. And I didn’t realize how bad it was until I received the latest White House Coronavirus Task Force (WHCTF) report, graphed the data and read their guidance. If you’re a Game of Thrones fan, we have transitioned from Winter is Coming to Winter is Here.
If you haven’t been taking the pandemic seriously for the past few weeks to months, I’m going to encourage you to start doing so now. How high this wave goes is largely within our control - we need the collective action of individuals to stop the spread of disease, preserve hospital capacity, and prevent unnecessary deaths.
Testing
Perhaps you’ve heard the rumor that the reason we are seeing more cases is because we’re doing more testing. Let’s see whether that idea is supported by the data for Kansas. First, consider how our test rate per 100,000 varies over time and how it compares to the national trend.
The Kansas test rate (blue line) is flat for the past three weeks. We haven’t actually been doing more testing. We seem to have hit a ceiling.
If we look at the day to day trend reported by the Kansas Department of Health and the Environment, look at how total tests performed and total positives each day has changed over time. You’ll notice that test output dips on the weekends - this is because most commercial laboratories do not work at full capacity over the weekends.
The blue line shows total tests performed. The gray line shows how many tests are positive (corresponds to the right y-axis). What you’ll notice is that the trend of test output is largely a predictable pattern, with a small increase in the past week. But if we look at the gray line, what we see is that each week’s peak has gotten higher and higher. This week’s peak is 56% higher than the previous week. So, back to the original premise - the data do not support the idea that the reason why we are seeing so many more cases is because we are performing more testing - because we are not doing more testing at all.
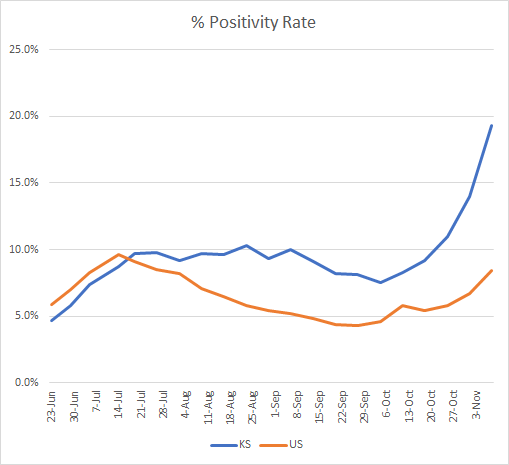
The test positivity rate is considered alongside the case rate to estimate how much of the case rate might be an undercount of the situation. The higher the positive rate, the more likely that we are missing cases due to inadequate testing. Let’s look at what the WHCTF is tracking for the Kansas positive rate.
Kansas is represented by the blue line. Not only is our positive rate 130% higher than the national rate, it is rapidly increasing. As of the most recent WHCTF report, our positive rate is 19.3%. That means that nearly one in every five COVID-19 tests is coming back positive - and this only considers the PCR based testing. It does not include the antigen testing that is more rapid and gaining in popularity. So not only are our case rates high (as you’ll see in the next section), but we are only capturing the tip of the iceberg - it is probably much worse than we realize.
Cases
The case rate for Kansas is now more than twice as high as the national average, and it is rapidly accelerating. In fact, it looks like we have entered exponential growth - dreaded words for anyone who works in public health.
The thing about exponential growth is that things will look okay until they don’t. And then things get very bad, very quickly. It can be hard to identify exponential growth when it begins, because our best case data are often as much as 2 weeks old, due to the virus incubation period, the timeline of test-seeking behavior, and how long it takes for a test to be performed and reported. We often see it as we look back, and by that time, the momentum is in favor of dramatic increases. No matter what we do today, the people who are going to be sick next week have already been exposed this week. The people who will arrive in the hospital next week were infected 1-2 weeks prior. So our collective actions to control the spread of disease are an investment with delayed return - we won’t see the effects for 2-3 weeks but it is critically important that we do so. We get to decide how high this peak goes. Limit your exposures as much as possible. Here’s some of the recommendations from the WHCTF to that end:
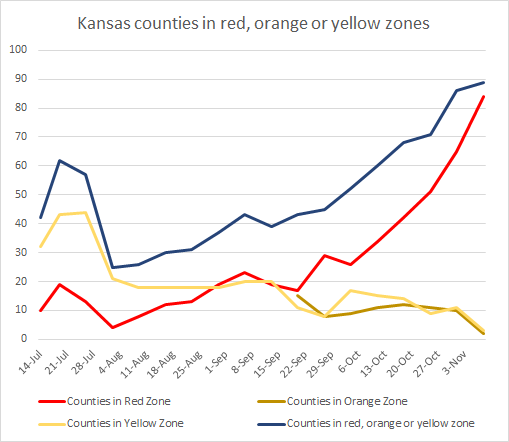
The number of Kansas counties in the red zone is skyrocketing, as shown in the graph below.
Here we can see where those red zone counties are located. Kansas has no counties in the orange or yellow categories. The second map shows how each county has increased or decreased (green is good, red is bad).
If we subdivide the state’s counties according to population density, it doesn’t seem to matter what kind of community you come from. Cases are growing exponentially for all county types. The data to build this graph come directly from the Kansas DHE. You can check your county’s classification here.
Hospitalizations
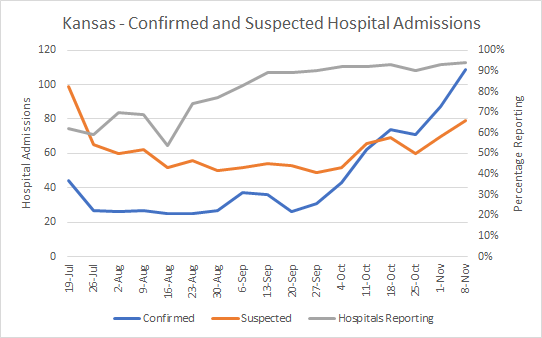
Hospitalizations are also trending up, according to WHCTF data. The blue line shows the hospital admissions among patients with COVID-19 disease confirmed by laboratory testing. The orange line indicates those patients admitted with suspected COVID-19 disease who are waiting for laboratory results.
You can see that both confirmed and suspected COVID-19 hospital admissions are increasing. Please remember that our healthcare infrastructure has its limits. ICU beds aren’t plug and play and the specialized physicians, nurses and respiratory therapists who care for the patients in those beds are not expendable or limitless resources. They are specialists and their expertise is not easily replaced by asking someone else in the hospital to fill in for them. I don’t think enough people know how much this expertise matters. Please honor the dedication and risk that our healthcare workers are taking on the frontlines with your actions.
Deaths
An unfortunate thing about this pandemic is its predictability. When cases surge, hospitalizations usually surge two weeks later and deaths surge 3-4 weeks later. If we want to limit the number of deaths, the best way to do that is to prevent cases in the first place.
The death rate for Kansas is ~2.5 times higher than the national rate. If we look at where these deaths are coming from, in terms of county population density, we see that the rates are highest in our least populated counties - frontier and rural counties. This is consistent with what I’ve seen for other states I’ve analyzed. There may be a false sense of belief that because you live in a rural setting you might be less likely to encounter the virus - but this is incorrect. Assume that this virus is everywhere.
As we approach the Thanksgiving holiday, I would strongly caution against gathering with anyone outside of your household or quarantine pod or bubble. The virus only cares about reaching the next human to infect, for its own survival. But the virus has a weakness - it can’t move on its own. When people move, the virus moves. When we gather, we give the virus the opportunity it needs to survive. When you think like a virus, it’s easier to understand that a person can love someone very much and still give them a potentially fatal illness. This isn’t a matter of love and trust. It’s a matter of biology and physics. Weigh the tradeoff of whether it’s more important to celebrate with Grandma this year on Thanksgiving, or whether it’s more important to celebrate future grandbabies, graduations, birthdays, weddings, etc. It is my hope that next year’s Thanksgiving will have fewer obstacles and we can gather more “normally.”
References
https://www.coronavirus.kdheks.gov/160/COVID-19-in-Kansas
http://www.ipsr.ku.edu/ksdata/ksah/population/popden2.pdf
WHCTF report, obtained through an open records request to Kansas Department of Health and Environment: https://drive.google.com/file/d/1WJ3nVmTKnbZRkTIVOeCP_Olug2NZbCH7/view?usp=sharing
Kansas COVID-19 Updates is a free newsletter that depends on reader support. If you wish to subscribe please click the link below. There are free and paid options available.
My Ph.D. is in Medical Microbiology and Immunology. I've worked at places like Creighton University, the Centers for Disease Control & Prevention and Mercer University School of Medicine. All thoughts are my professional opinion and should not be considered medical advice.


