Hello readers! Here’s sort of a week in review of how the pandemic has gone for Kansas over time. First, we’ll start at a look at how several of our important metrics have trended over time. Most of the time, I prefer to look at these things separately, but graphing them together helps us to see some of the temporal associations between them. I only started collecting data for hospitalizations and ICU admissions around late October, so that’s why we only see some of that information. The left y-axis represents cases (corresponds with blue line). The right y-axis is for everything else, including hospitaliations, deaths and ICU admissions.
What we see is that cases really began taking off in a big way after 23Oct. Hospitalizations followed suit after 20Nov. So, for Kansas, there’s about a 4 week delay between case surge and hospital surge. Weekly deaths began to increase dramatically after 27Nov, so a delay of about 5 weeks. These are longer delays than other places in the country have noted, perhaps because the case surge began first with younger populations and didn’t make its way to older populations that are more vulnerable to complications until later. The most recent week’s case data appear to be decreasing here but that may be an artifact of decreased testing over the Thanksgiving holiday, as I’ll discuss in the next section. Meanwhile, hospitalizations, ICU admissions and deaths are rising sharply.
Testing
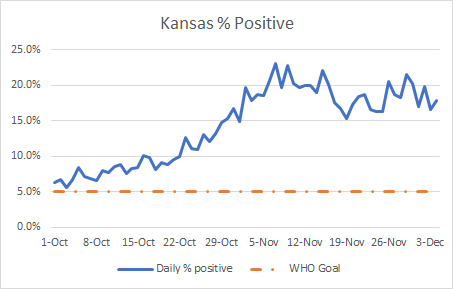
The last two weeks have been heavily impacted by the Thanksgiving holiday. Normally we see this consistent rhythm of test output (blue line, left y-axis in the graph below). But starting on 26Nov (Thanksgiving) the rhythmic peak was cut short and then really dropped off. In the most recent week, we see that the peak/valley thing is back, but at a much lower level than we’ve previously seen (35% less than the previous week). That’s not what things are looking like elsewhere in the country, where laboratories are churning out big results this week as they work through the holiday weekend backlog of specimens.
Meanwhile, the percent positive rate for Kansas still remains very high, with lots of daylight between our positive rate and the goal of 5%.
When positive rate is high, it means that we are missing cases. When we miss cases, they may not be aware they are sick, and contribute to ongoing disease transmission in the community. We cannot get our pandemic under control until we improve our test capacity and output.
Cases
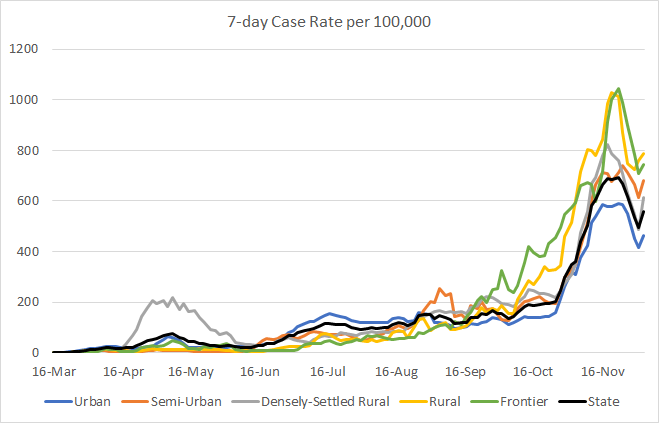
This week the state reported a net increase of 15,274 new cases which is a 17% decrease compared to the week before. However, that’s probably an undercount due to the Thanksgiving holiday laboratory closures. If we look at the data day to day, as shown in the graph below, then we see that what looked like a peak is showing an uptick across all county types with Friday’s data. You can check your county’s classification here.
If the peak is real and Thanksgiving didn’t happen, that may be just the noise of day to day data collection before continuing the trend downward. But given the Thanksgiving holiday’s impact on case reporting and also disease transmission with family gatherings and travel, we should brace for the very real possibility that this “peak” is a short-lived shoulder on a further escalation upward. The impact of those holiday gatherings will begin to be reported this coming week. Given how Kansas data has trended over time, we should expect the Thanksgiving impact on hospitalizations and deaths to really become clear 4-5 weeks after the holiday…leading us right into Christmas and New Years when we are likely to repeat the cycle.
The graph below shows us the age demographic data for each week’s newly reported cases for the past 8 weeks. From the combined data presented at the beginning of today’s update, cases began to surge weekly after 27Oct. With the graph below, we can see how that surge started.
Things really start to increase quickly during the week of 24-30Oct and the increases are greatest among those 25-44 years of age, increasing about 280% from their numbers at the start of this time series. However, there were smaller (but still important) increases among neighboring age cohorts. The majority of our deaths are among those 75+ (see the deaths section of today’s update). If you look at the graph above, you see that their case totals didn’t increase nearly as much - but they didn’t have to. Any disease in these populations is dangerous. But graphs like this help us to understand that the increases that start out in young people find their way to the elderly. And even if we don’t have the opportunity to see the consequences of our carelessness immediately, younger adult populations need to recognize that they are harming people in their community.
Hospitalizations
As noted in the combined data section at the top of this update, hospitalizations are on the rise, with 399 reported this week (Friday - Thursday). The graph below shows how hospitalizations have changed weekly for the past 8 weeks for each age group. In other words, you’re looking at 8-week timelines for each age group, side by side.
Remember from the case section that the case surge really happens for 25 - 44 year olds. But that’s not where the hospitalizations manifest. We see increases in hospital admissions over time for those 45+, but the most dramatic increases are among those 65+. For those 65-74, the hospitalizations increased 138% over the 8 week timeline. For those 75-84 the increase was smaller, 62%. But for those 85+, the hospitalizations rose 173%.
The next graph looks at data provided in the Kansas Department of Health and Environment (KDHE) updates on Monday, Wednesday and Fridays. Hospitalizations (shown in blue bars) are trending up over time. But so are ICU admissions, especially in the past week. In the previous weeks, ICU admissions peak with the Wednesday data update but then decrease by Friday. This week, however, the Friday data were the highest I’ve recorded to date. In total, there were 124 COVID-19 admissions to the ICU this week.
Kansas is nice, compared to other states I monitor, in that they provide the breakdown of how many ICUs and ventilators are in use for all patients and how many are in use for COVID-19. The graph below shows how COVID-19 demand for ICU beds (blue line) and ventilators (brown line) have trended over time, as a proportion of all beds/ventilators in use.
The use of both critical resources for COVID-19 has doubled since 25Oct. As of the most recent data, 46% of ventilators in use are in use to support COVID-19 patients. Meanwhile, 39% of ICU beds in use as of yesterday’s update are in use by COVID-19 patients. Overall, 70% of the state’s ICU beds are occupied.
Deaths
This week Kansas reported 257 deaths, more than twice the previous week’s total. Let’s take a look at how those deaths break down by age.
Again, whereas the case surge is most dramatic among those 25 - 44, with smaller increases for all 18 - 64, that’s not where the deaths are. We see increases in deaths over time for those 45+, increasing with each age group. For those 75+, the deaths have increased 170% over the past 8 weeks.
The graph below shows the death rate per 100,000 population for each county type in Kansas. The death rate is increasing for the statewide average, the worst it has ever been. The deaths are disproportionately worse in rural counties, but deaths are increasing for all county types.
So where it’s possible that we peaked temporarily for cases, hospitalizations and deaths have not seen that slowdown in momentum. It’s important to remember that the actions we take this week impact the people who test positive next week and the people who need a hospital bed and those who die in the weeks to follow. Stop giving the virus the opportunity to spread and we save lives.
References
https://www.coronavirus.kdheks.gov/160/COVID-19-in-Kansas
http://www.ipsr.ku.edu/ksdata/ksah/population/popden2.pdf
Kansas COVID-19 Updates is a free newsletter that depends on reader support. If you wish to subscribe please click the link below. There are free and paid options available.
My Ph.D. is in Medical Microbiology and Immunology. I've worked at places like Creighton University, the Centers for Disease Control & Prevention and Mercer University School of Medicine. All thoughts are my professional opinion and should not be considered medical advice.


