Happy Sunday! Today we’re going to dig into a lot of the demographic data for Kansas over the past week.
Testing
This week, the state of Kansas reported 26,520 COVID-19 test results and 8951 of those were positive (33.8% positive rate for this week). Below, you can see how the daily percent positive rate has moved over time. The red dashed line is the goal for percent positive rate set by the World Health Organization. The closer you are to the red line, the better you’re doing at testing enough of your population. The more your percent positive rate exceeds that, the more it means that we are likely missing cases in our community. That means that the cases we are identifying (see cases section below) are likely an undercount of the situation on the ground.

The percent positive rate has been climbing steadily this month.
Cases
This week, the state of Kansas reported a net increase of 8951 newly reported cases. That’s an increase of 3573 cases (or +66%) compared to the week before. Here’s a graph that shows how those cases were distributed across age groups.

The increases were observed across all age groups, but were greatest among those considered working-aged population (18 - 64). That doesn’t necessarily mean that these folks contracted the disease at their place of work.
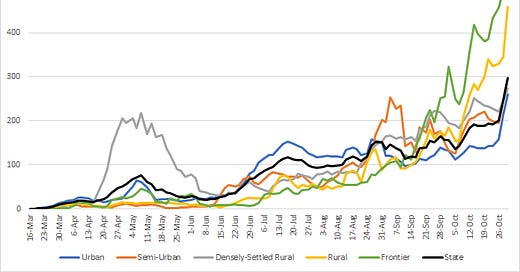
Next, let’s look at how the case rate per 100,000 people has varied over time for counties of different size across the state. You can look up how your county is classified by visiting this map.

Case rates are most intense in frontier and rural counties. So please don’t fall into the faulty assumption that because your community isn’t densely populated that you’re somehow immune to this disease. Because you’re not. The thing most concerning to me about this graph is the way that the state average (black line) and every county type shows a sharp increase in the most recent days. Let me tell you from the history I have tracking the COVID-19 pandemic in the South during their summer surge that this is not a good sign for Kansas.
Hospitalizations
This week there were 248 Kansans newly admitted to the hospital for COVID-19. This is an increase of 34 patients (+16%) compared to the previous week. There were 66 patients newly admitted to the ICU and 14 patients required mechanical ventilation. So, on average, 26.6% of hospitalized patients needed an ICU and 5.6% of hospitalized patients needed a ventilator.
Let’s take a look at how hospitalizations have varied by age group in the past three weeks. The increases this week are among those aged 0 - 44 and 55 - 84, with the largest increase among those aged 75 - 84.

Next, let’s consider how hospitalizations this week were distributed by race. Keep in mind, these are total counts, not adjusted for population.

Deaths
Deaths in Kansas by sex show a disproportionate effect on men, with men making up 56% of the COVID-19 deaths compared to women who make up 42% of deaths. There were a total of 54 newly reported deaths this week, a decrease of 62 (-53%) compared to the previous week. This is certainly welcome news however I fear that it will be only a temporary reprieve as we see cases and hospitalizations increasing. Please do all that you can to limit your exposures by wearing a mask when in public, limiting unnecessary errands, and keeping your interactions with people you don’t live with brief and socially distant.
The graph below shows how deaths have been distributed by age group for the past three weeks. As noted above, deaths are down this week, but the ones that did happen were much greater among those >75 years of age than in younger populations.

As we did for cases, let’s look at how deaths adjusted for population have varied across different county types over time. In October, we’ve seen a greater death rate for COVID-19 than Kansas has ever experienced since the pandemic arrived.

For much of the pandemic, the deaths have disproportionately affected those residing in frontier counties, but we have also seen a time in late September and in June when densely-settled rural counties were heavily impacted. Most recently, rural counties also have a death rate that exceeds the statewide rate.
There’s also a disproportionate impact on different races. If we look at death rate in Kansas, adjusted for population, then the death rate is greatest for those in the “other” category, which includes the majority of people who identify as Hispanic or Latinx. Their death rate is 156% higher than that of White populations. For the Black / African-American population the death rate is 63% higher than White population. Meanwhile, the death rate among American Indian / Alaska Native and Asian populations is less than the White death rate.

That’s it for now. Enjoy your day!
References
https://www.coronavirus.kdheks.gov/160/COVID-19-in-Kansas
http://www.ipsr.ku.edu/ksdata/ksah/population/popden2.pdf
Kansas COVID-19 Updates is a free newsletter that depends on reader support. If you wish to subscribe please click the link below. There are free and paid options available.
My Ph.D. is in Medical Microbiology and Immunology. I've worked at places like Creighton University, the Centers for Disease Control & Prevention and Mercer University School of Medicine. All thoughts are my professional opinion and should not be considered medical advice.


